1. First steps with Helm
The webcourse this section is based upon uses kind as its K8s engine, so let’s install that and create a kind cluster.
$ sudo snap install go --classic
go 1.22.5 from Canonical✓ installed
$ go install sigs.k8s.io/kind@v0.23.0
Add $HOME/go/bin to your $PATH environment variable, for example in $HOME/.bashrc.
$ kind create cluster
Creating cluster "kind" ...
 ✓ Ensuring node image (kindest/node:v1.30.0) 🖼
 ✓ Preparing nodes 📦
 ✓ Writing configuration 📜
 ✓ Starting control-plane 🕹️
 ✓ Installing CNI 🔌
 ✓ Installing StorageClass 💾
Set kubectl context to "kind-kind"
You can now use your cluster with:

kubectl cluster-info --context kind-kind

Not sure what to do next? 😅  Check out https://kind.sigs.k8s.io/docs/user/quick-start/
$ kubectl cluster-info --context kind-kind
kubectl cluster-info --context kind-kind
Kubernetes control plane is running at https://127.0.0.1:46753
CoreDNS is running at https://127.0.0.1:46753/api/v1/namespaces/kube-system/services/kube-dns:dns/proxy

To further debug and diagnose cluster problems, use 'kubectl cluster-info dump'.
Next, install Helm:
$ sudo snap install helm --classic
helm 3.15.3 from Snapcrafters✪ installed
1.1. Install a public chart
We shall use the K8s dashboard as an example helm chart. Note that unlike before with Minikube where we only needed to type minikube dashboard, we now need to install the dashboard ourselves.
First, add the dashboard repo to Helm:
$ helm repo list
Error: no repositories to show
$ helm repo add kubernetes-dashboard https://kubernetes.github.io/dashboard/
"kubernetes-dashboard" has been added to your repositories
$ helm repo list
NAME                    URL
kubernetes-dashboard    https://kubernetes.github.io/dashboard/
Next check what charts are available in the added repo. We can use regex to avoid typing the full repo name (or omit all arguments to helm search repo to show all available charts):
$ helm search repo -r "^kube"
NAME                                            CHART VERSION   APP VERSION     DESCRIPTION
kubernetes-dashboard/kubernetes-dashboard       7.5.0                           General-purpose web UI for Kubernetes clusters
Install the K8s dashboard in the monitoring namespace, creating it if necessary:
$ helm install dashboard kubernetes-dashboard/kubernetes-dashboard -n monitoring --create-namespace
NAME: dashboard
LAST DEPLOYED: Mon Aug 5 07:53:09 2024
NAMESPACE: monitoring
STATUS: deployed
REVISION: 1
TEST SUITE: None
NOTES:
*************************************************************************************************
*** PLEASE BE PATIENT: Kubernetes Dashboard may need a few minutes to get up and become ready ***
*************************************************************************************************
Congratulations! You have just installed Kubernetes Dashboard in your cluster.
To access Dashboard run:
kubectl -n kubernetes-dashboard port-forward svc/kubernetes-dashboard-kong-proxy 8443:443
NOTE: In case port-forward command does not work, make sure that kong service name is correct.
Check the services in Kubernetes Dashboard namespace using:
kubectl -n monitoring get svc
Dashboard will be available at:
https://localhost:8443
$ helm list -n monitoring
NAME NAMESPACE REVISION UPDATED STATUS CHART APP VERSION
dashboard monitoring 1 2024-08-05 07:53:09.211946778 +0100 BST deployed kubernetes-dashboard-7.5.0
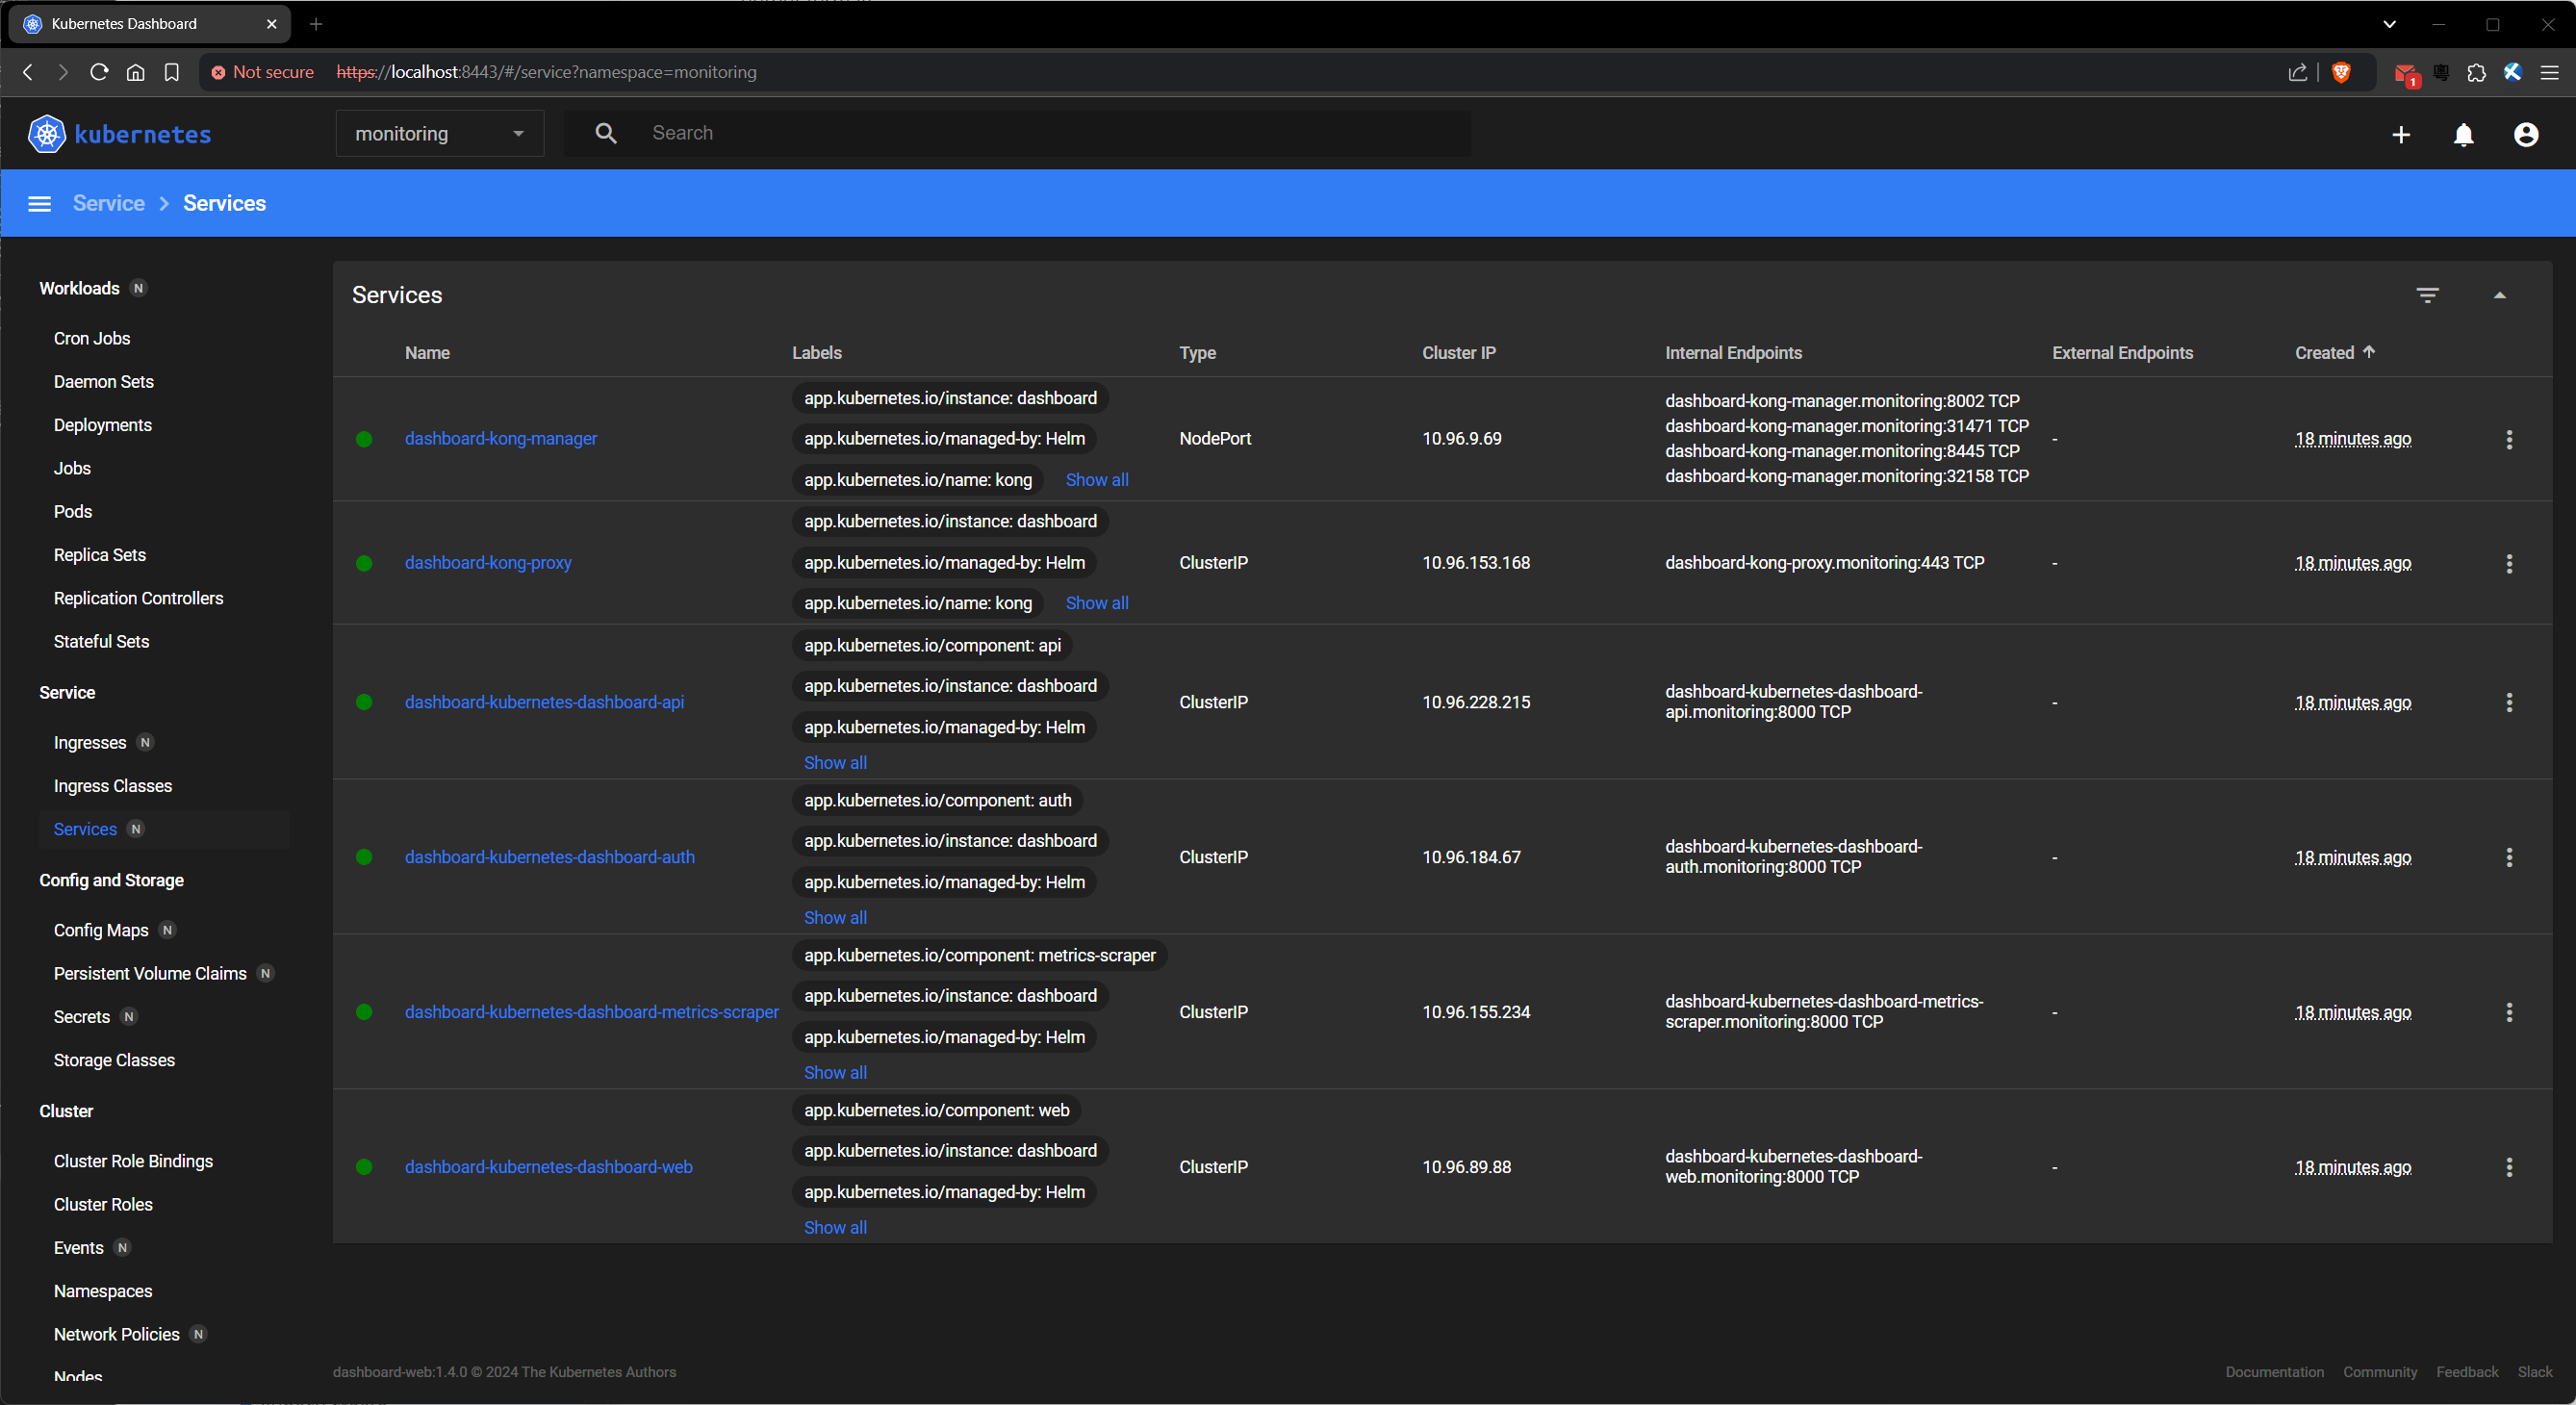
$ kubectl get svc -n monitoring
NAME TYPE CLUSTER-IP EXTERNAL-IP PORT(S) AGE
dashboard-kong-manager NodePort 10.96.76.115 <none> 8002:31680/TCP,8445:31787/TCP 49s
dashboard-kong-proxy ClusterIP 10.96.182.46 <none> 443/TCP 49s
dashboard-kubernetes-dashboard-api ClusterIP 10.96.158.199 <none> 8000/TCP 49s
dashboard-kubernetes-dashboard-auth ClusterIP 10.96.31.90 <none> 8000/TCP 49s
dashboard-kubernetes-dashboard-metrics-scraper ClusterIP 10.96.196.152 <none> 8000/TCP 49s
dashboard-kubernetes-dashboard-web ClusterIP 10.96.51.14 <none> 8000/TCP 49s
Warning
Since we specified the monitoring namespace, the instructions in the console output are incorrect. Furthermore, the service we need is called dashboard-kong-proxy, not kubernetes-dashboard-kong-proxy.
$ kubectl -n monitoring port-forward svc/dashboard-kong-proxy 8443:443
Visit https://localhost:8443 and ignore the security warning. You will be prompted for a bearer token.
1.2. Cluster role binding
So we can use the dashboard without restrictions, let us create a ClusterRoleBinding for the default serviceaccount in the monitoring namespace:
$ kubectl -n monitoring get clusterrole | grep -v system
NAME                                                                   CREATED AT
admin                                                                  2024-08-05T05:13:26Z
cluster-admin                                                          2024-08-05T05:13:26Z
dashboard-kubernetes-dashboard-metrics-scraper                         2024-08-05T05:31:04Z
edit                                                                   2024-08-05T05:13:26Z
kindnet                                                                2024-08-05T05:13:32Z
kubeadm:get-nodes                                                      2024-08-05T05:13:29Z
local-path-provisioner-role                                            2024-08-05T05:13:33Z
view                                                                   2024-08-05T05:13:26Z
Note
grep -v shows lines without the supplied search string.
We want to apply the cluster-admin role:
$ kubectl -n monitoring create clusterrolebinding dashboard-kubernetes-dashboard \
  --clusterrole=cluster-admin --serviceaccount=monitoring:default
clusterrolebinding.rbac.authorization.k8s.io/dashboard-kubernetes-dashboard created
1.3. Bearer token
Finally, create the token we need to log in:
$ kubectl -n monitoring create token default --duration 8760h | tee kind-dashboard-token
Use the token returned above to log in at https://localhost:8443. Choose the monitoring namespace in the top menu bar to see its associated resources.
1.4. Enabling the metrics server
Inspect the kubernetes-dashboard chart:
$ helm show chart kubernetes-dashboard/kubernetes-dashboard | yq
apiVersion: v2
dependencies:
  - alias: nginx
    condition: nginx.enabled
    name: ingress-nginx
    repository: https://kubernetes.github.io/ingress-nginx
    version: 4.10.1
  - condition: cert-manager.enabled
    name: cert-manager
    repository: https://charts.jetstack.io
    version: v1.14.5
  - condition: metrics-server.enabled
    name: metrics-server
    repository: https://kubernetes-sigs.github.io/metrics-server/
    version: 3.12.1
  - condition: kong.enabled
    name: kong
    repository: https://charts.konghq.com
    version: 2.38.0
description: General-purpose web UI for Kubernetes clusters
home: https://github.com/kubernetes/dashboard
icon: https://raw.githubusercontent.com/kubernetes/kubernetes/master/logo/logo.svg
keywords:
  - kubernetes
  - dashboard
kubeVersion: '>=1.21.0-0'
maintainers:
  - email: cdesaintmartin@wiremind.fr
    name: desaintmartin
  - email: s.florek91@gmail.com
    name: floreks
name: kubernetes-dashboard
sources:
  - https://github.com/kubernetes/dashboard
version: 7.5.0
We can see a number of optional dependencies for our chart. Check which ones are enabled by inspecting the values set for this installation:
$ helm show values kubernetes-dashboard/kubernetes-dashboard | \
  yq '.nginx.enabled,.cert-manager.enabled,.metrics-server.enabled,.kong.enabled'
false
false
false
true
This shows that only the kong dependency has been enabled. We want to enable the metrics-server dependency as well.
$ helm show values kubernetes-dashboard/kubernetes-dashboard | yq '.metrics-server'
enabled: false
args:
  - --kubelet-preferred-address-types=InternalIP
  - --kubelet-insecure-tls
Create a yaml file to apply:
$ cat > enable-metrics-server.yaml <<EOF
metrics-server:
  enabled: true
EOF
$ helm upgrade dashboard kubernetes-dashboard/kubernetes-dashboard \
  -n monitoring --wait --timeout 60s --values enable-metrics-server.yaml
Release "dashboard" has been upgraded. Happy Helming!
NAME: dashboard
LAST DEPLOYED: Mon Aug  5 07:58:51 2024
NAMESPACE: monitoring
STATUS: deployed
REVISION: 2
TEST SUITE: None
NOTES:
*************************************************************************************************
*** PLEASE BE PATIENT: Kubernetes Dashboard may need a few minutes to get up and become ready ***
*************************************************************************************************

Congratulations! You have just installed Kubernetes Dashboard in your cluster.

To access Dashboard run:
  kubectl -n kubernetes-dashboard port-forward svc/kubernetes-dashboard-kong-proxy 8443:443

NOTE: In case port-forward command does not work, make sure that kong service name is correct.
      Check the services in Kubernetes Dashboard namespace using:
        kubectl -n monitoring get svc

Dashboard will be available at:
  https://localhost:8443
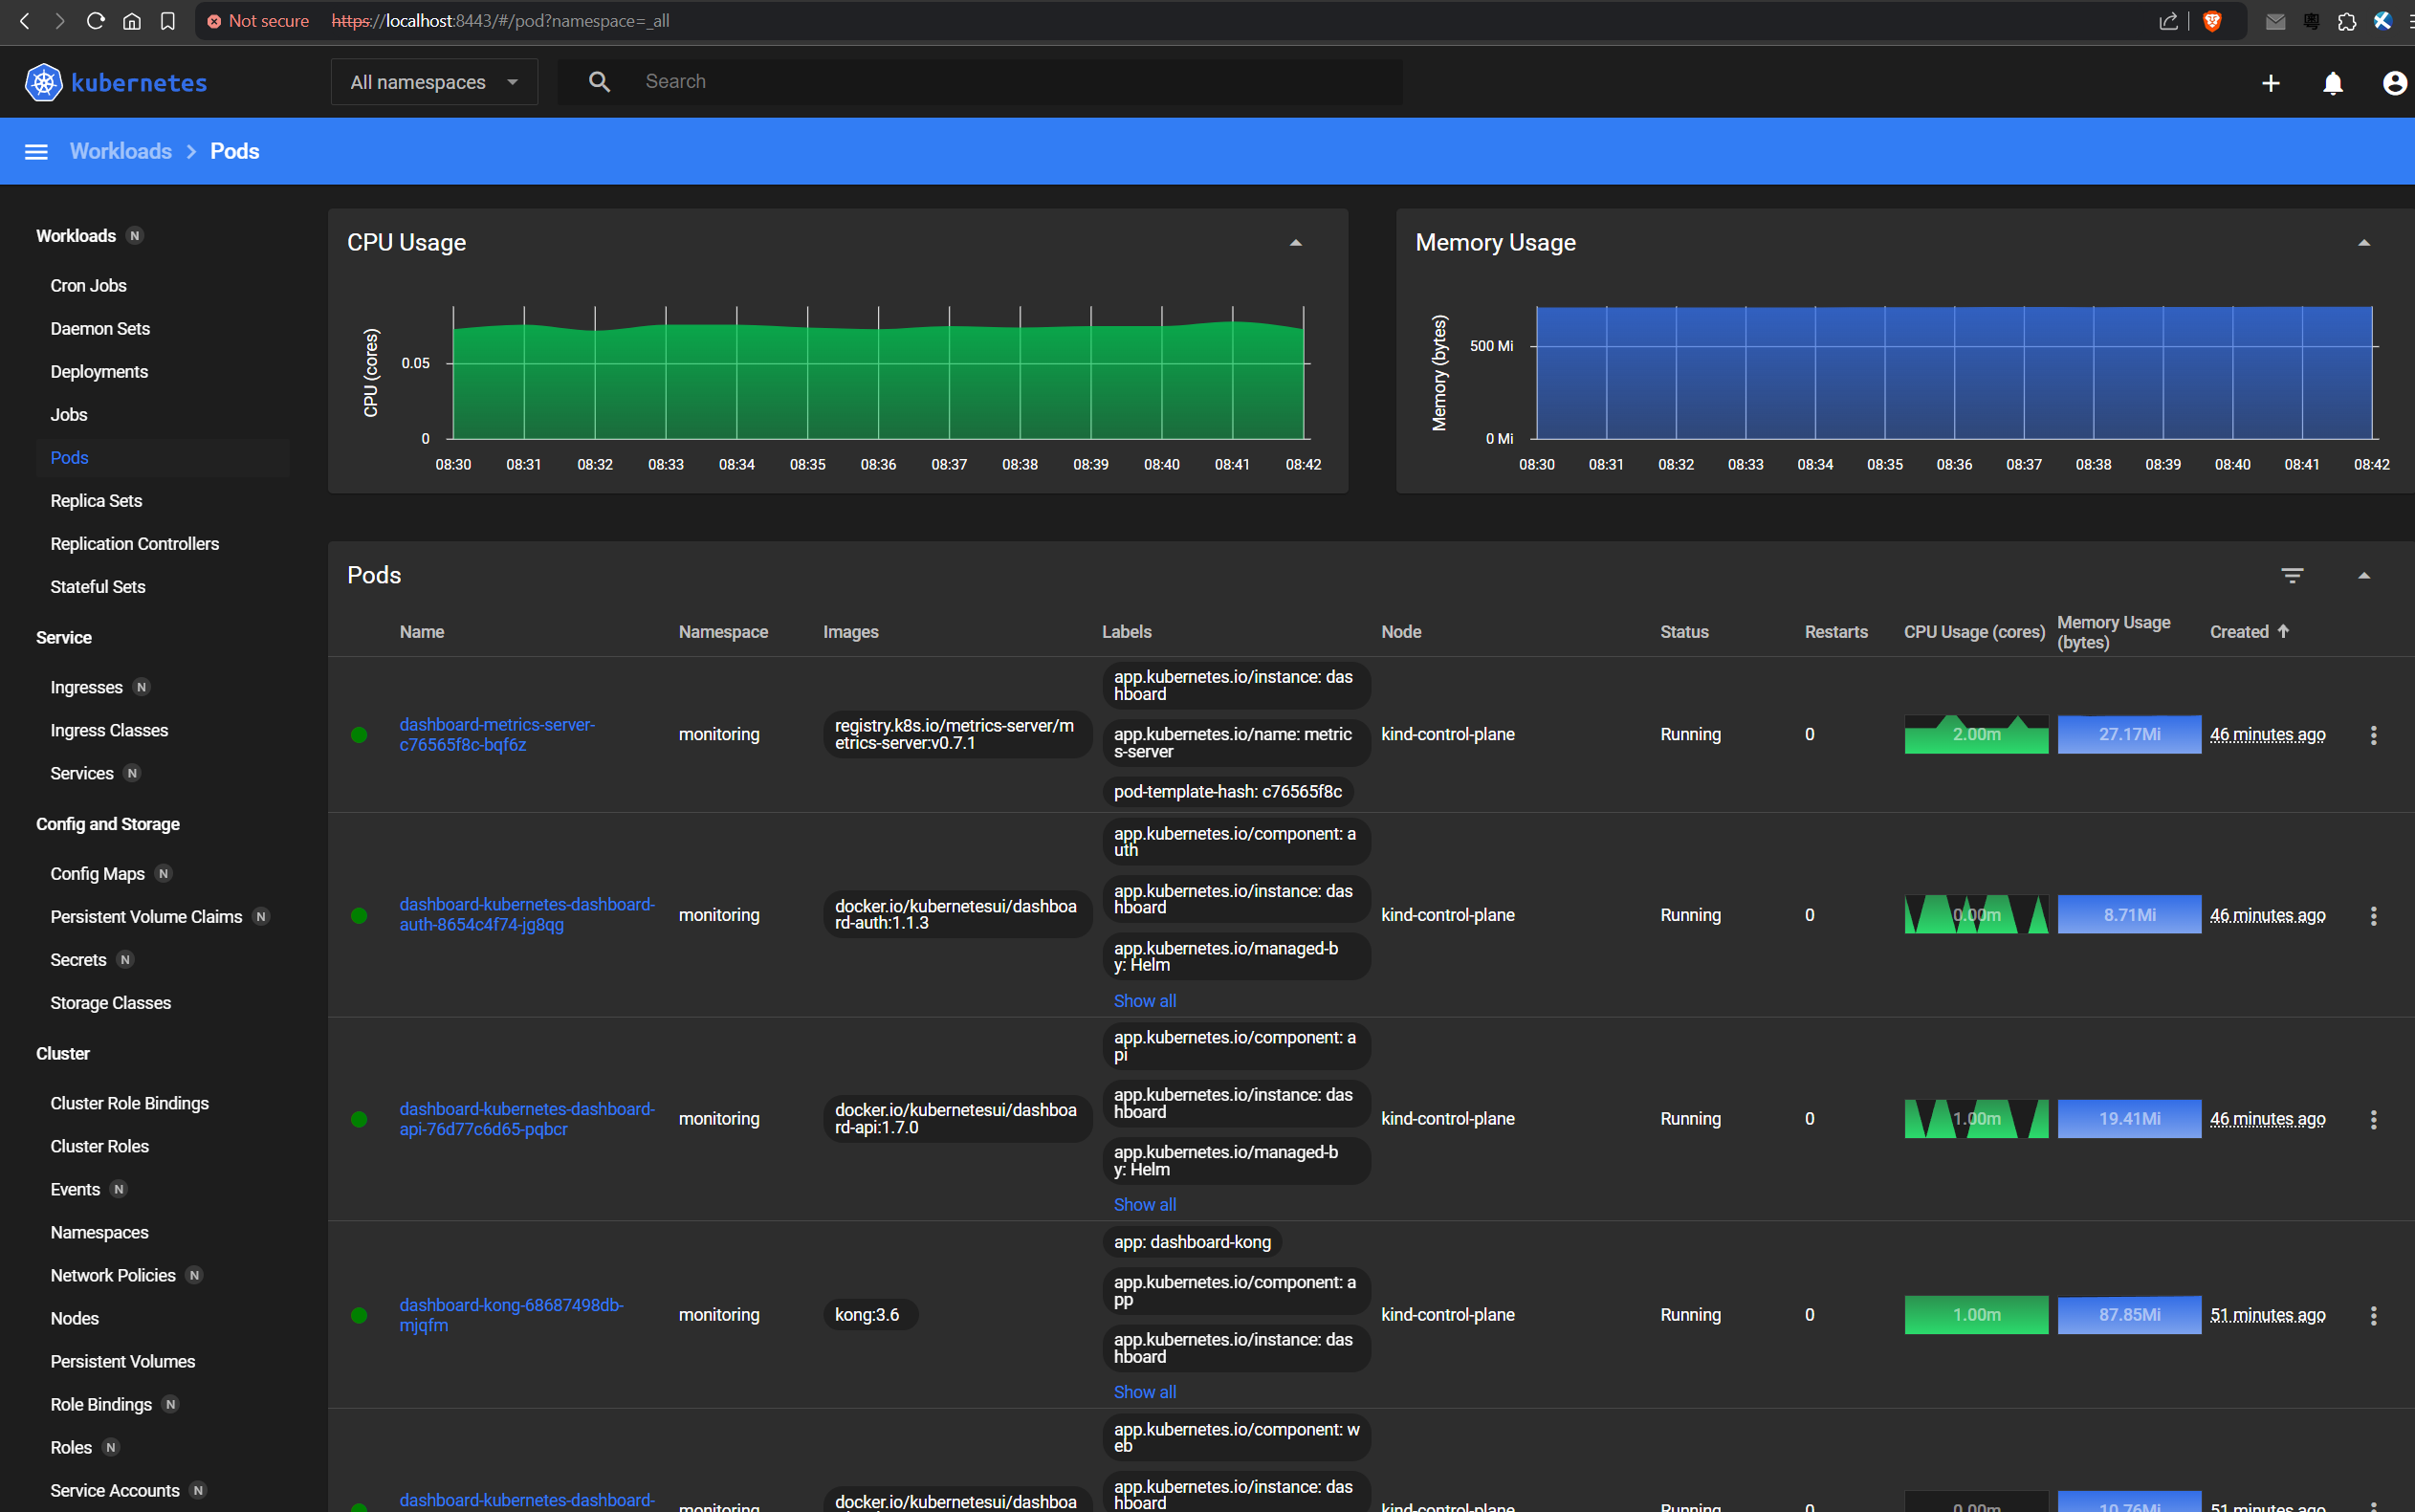
Warning
Once again, the port-forward instructions are incorrect.
After several minutes, the dashboard should look like this:
1.5. Rollout history
Having upgraded our dashboard by enabling the metrics-server, let us check the rollout history:
$ helm history dashboard -n monitoring
REVISION        UPDATED                         STATUS          CHART                           APP VERSION     DESCRIPTION
1               Mon Aug  5 07:53:09 2024        superseded      kubernetes-dashboard-7.5.0                      Install complete
2               Mon Aug  5 07:58:51 2024        deployed        kubernetes-dashboard-7.5.0                      Upgrade complete
1.6. Deploy and rollback a bad configuration
Once again, let us check the default chart values for the dashboard’s metric server:
$ helm show values kubernetes-dashboard/kubernetes-dashboard | yq '.metrics-server'
enabled: false
args:
  - --kubelet-preferred-address-types=InternalIP
  - --kubelet-insecure-tls
$ cat > error.yaml <<EOF
metrics-server:
  enabled: true
  args:
    - --invalid-arg-1
    - --invalid-arg-2
EOF
Deploy the bad configuration, ensuring that we --wait for it to fail:
$ helm upgrade dashboard kubernetes-dashboard/kubernetes-dashboard \
  -n monitoring --wait --timeout 60s --values error.yaml
Error: UPGRADE FAILED: context deadline exceeded
Check the rollout logs:
$ helm history dashboard -n monitoring
REVISION        UPDATED                         STATUS          CHART                           APP VERSION     DESCRIPTION
1               Mon Aug  5 15:37:18 2024        superseded      kubernetes-dashboard-7.5.0                      Install complete
2               Mon Aug  5 15:37:32 2024        deployed        kubernetes-dashboard-7.5.0                      Upgrade complete
3               Mon Aug  5 15:41:39 2024        failed          kubernetes-dashboard-7.5.0                      Upgrade "dashboard" failed: context deadline exceeded
Rollback to Revision 2:
$ helm rollback dashboard 2 -n monitoring --wait --timeout 60s
Rollback was a success! Happy Helming!
$ helm history dashboard -n monitoring
REVISION        UPDATED                         STATUS          CHART                           APP VERSION     DESCRIPTION
1               Mon Aug  5 15:37:18 2024        superseded      kubernetes-dashboard-7.5.0                      Install complete
2               Mon Aug  5 15:37:32 2024        superseded      kubernetes-dashboard-7.5.0                      Upgrade complete
3               Mon Aug  5 15:41:39 2024        failed          kubernetes-dashboard-7.5.0                      Upgrade "dashboard" failed: context deadline exceeded
4               Mon Aug  5 15:53:26 2024        deployed        kubernetes-dashboard-7.5.0                      Rollback to 2