3. The Kubernetes dashboard
Minikube includes an easy command for acessing the dashboard. First, let us add the Metrics Server to the dashboard:
minikube addons enable metrics-server
You should see the following output:
💡  metrics-server is an addon maintained by Kubernetes. For any concerns contact minikube on GitHub.
You can view the list of minikube maintainers at: https://github.com/kubernetes/minikube/blob/master/OWNERS
    ▪ Using image registry.k8s.io/metrics-server/metrics-server:v0.7.1
🌟  The 'metrics-server' addon is enabled
Next, launch the dashboard:
minikube dashboard
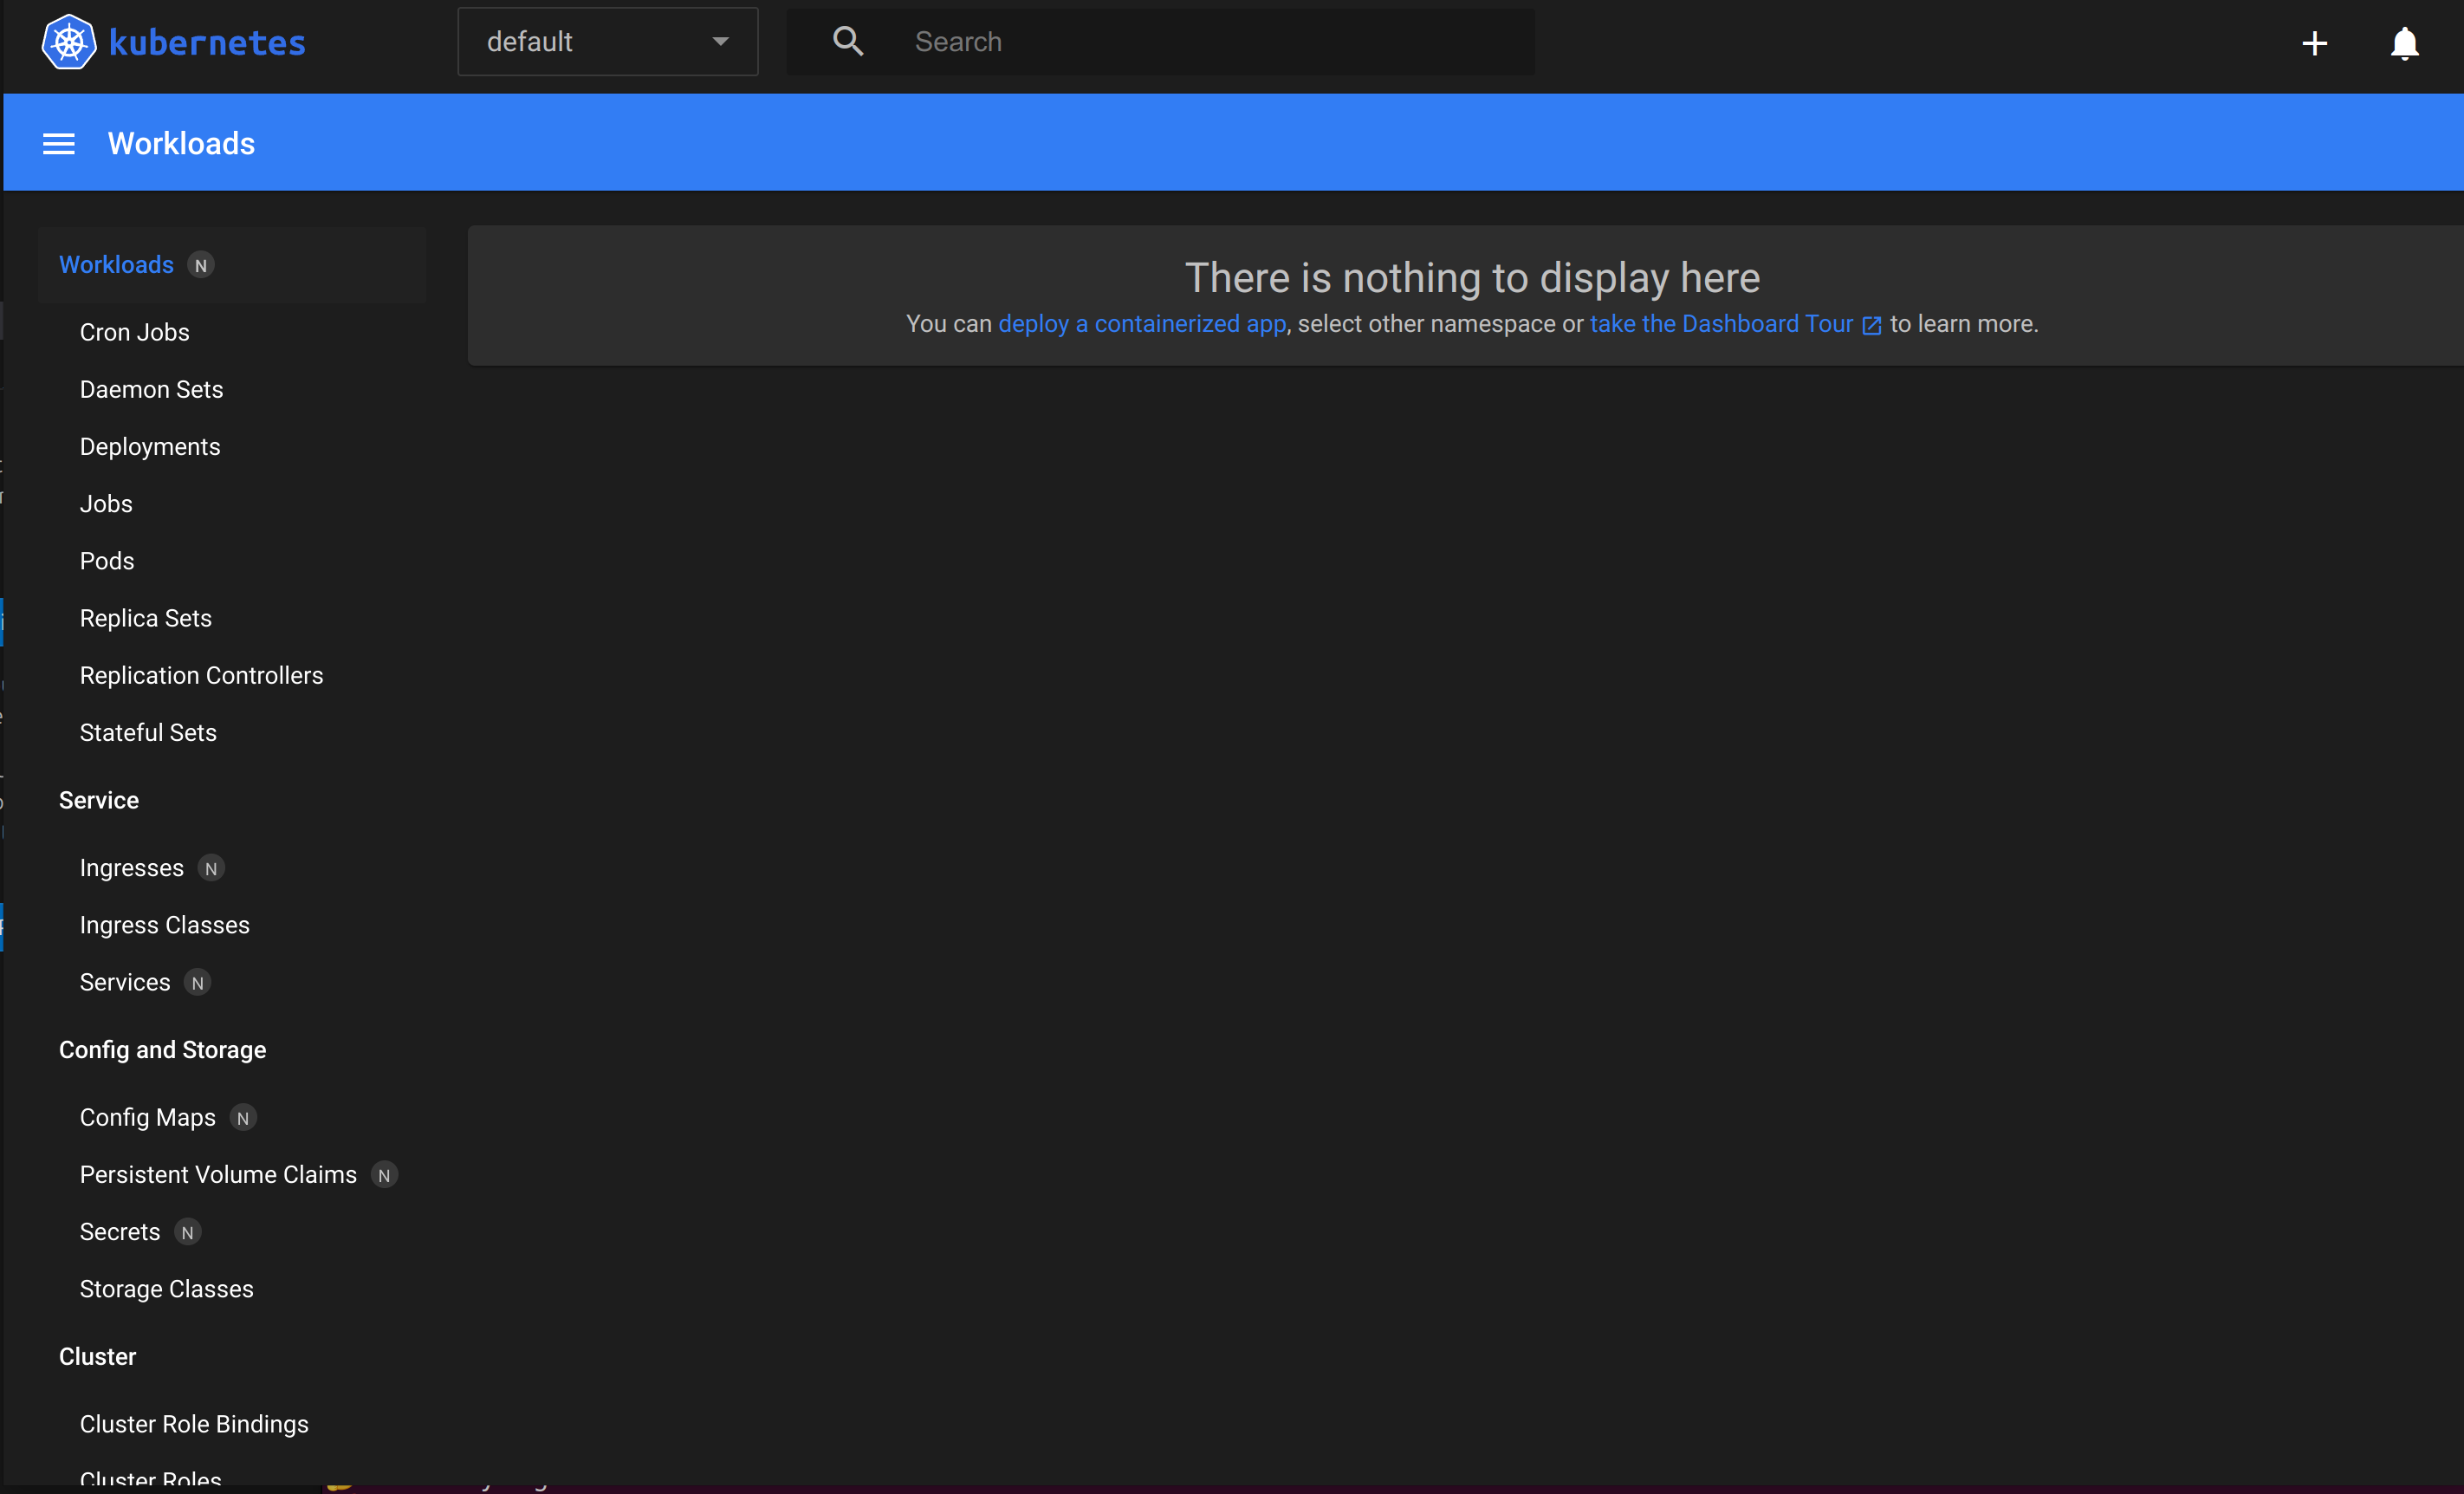
Initially, you will see “There is nothing to display here”, as we have not added any pods/deployments/services to the default namespace.
Note
A namespace is a logical grouping of K8s entities. Many kubectl commands use a -n flag to select the namespace to act on.
Use the top menubar to select all namespaces, then select Services from the left sidebar. You will see kubernetes-dashboard as one of the services. Node that kubernetes-dashboard is also the name of a deployment, and a pod exists with name kubernetes-dashboard-779776cb65-bzx7t (or similar). The relationship between these will be explained in later sections.
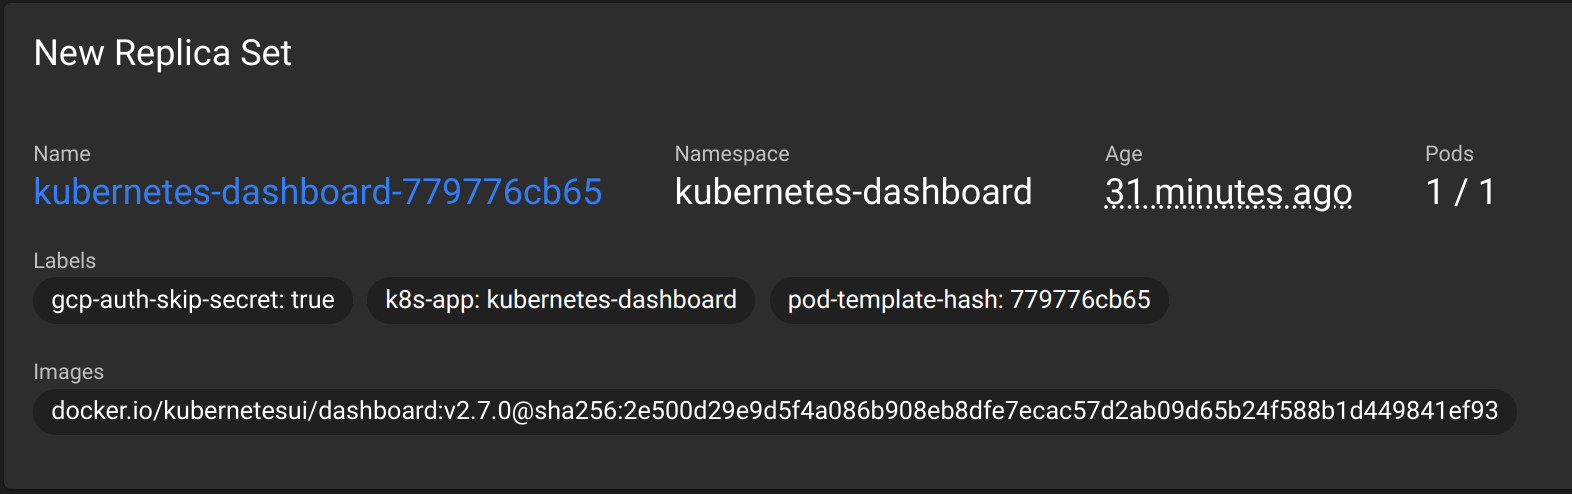
Select Deployments > kubernetes-dashboard and scroll down to find the “New Replica Set” section. The name of the image used to provide the K8s dashboard service can be found here.
3.1. Accessing the dashboard remotely
K8s exposes its services on port 8001 by default. Activate this as follows (replace the login details with your own):
user@local$ ssh -L 12345:localhost:8001 user@remote
user@remote's password:

user@remote$ kubectl proxy
Starting to serve on 127.0.0.1:8001
Then, on the local machine, go to http://localhost:12345/api/v1/namespaces/kubernetes-dashboard/services/http:kubernetes-dashboard:/proxy/ to open the K8s dashboard.
3.2. Next steps
We will mostly use the command line to configure our K8s cluster; however, any changes will show in the dashboard.